Evaluating Financial Variables in Contrarian Strategy
Abstract
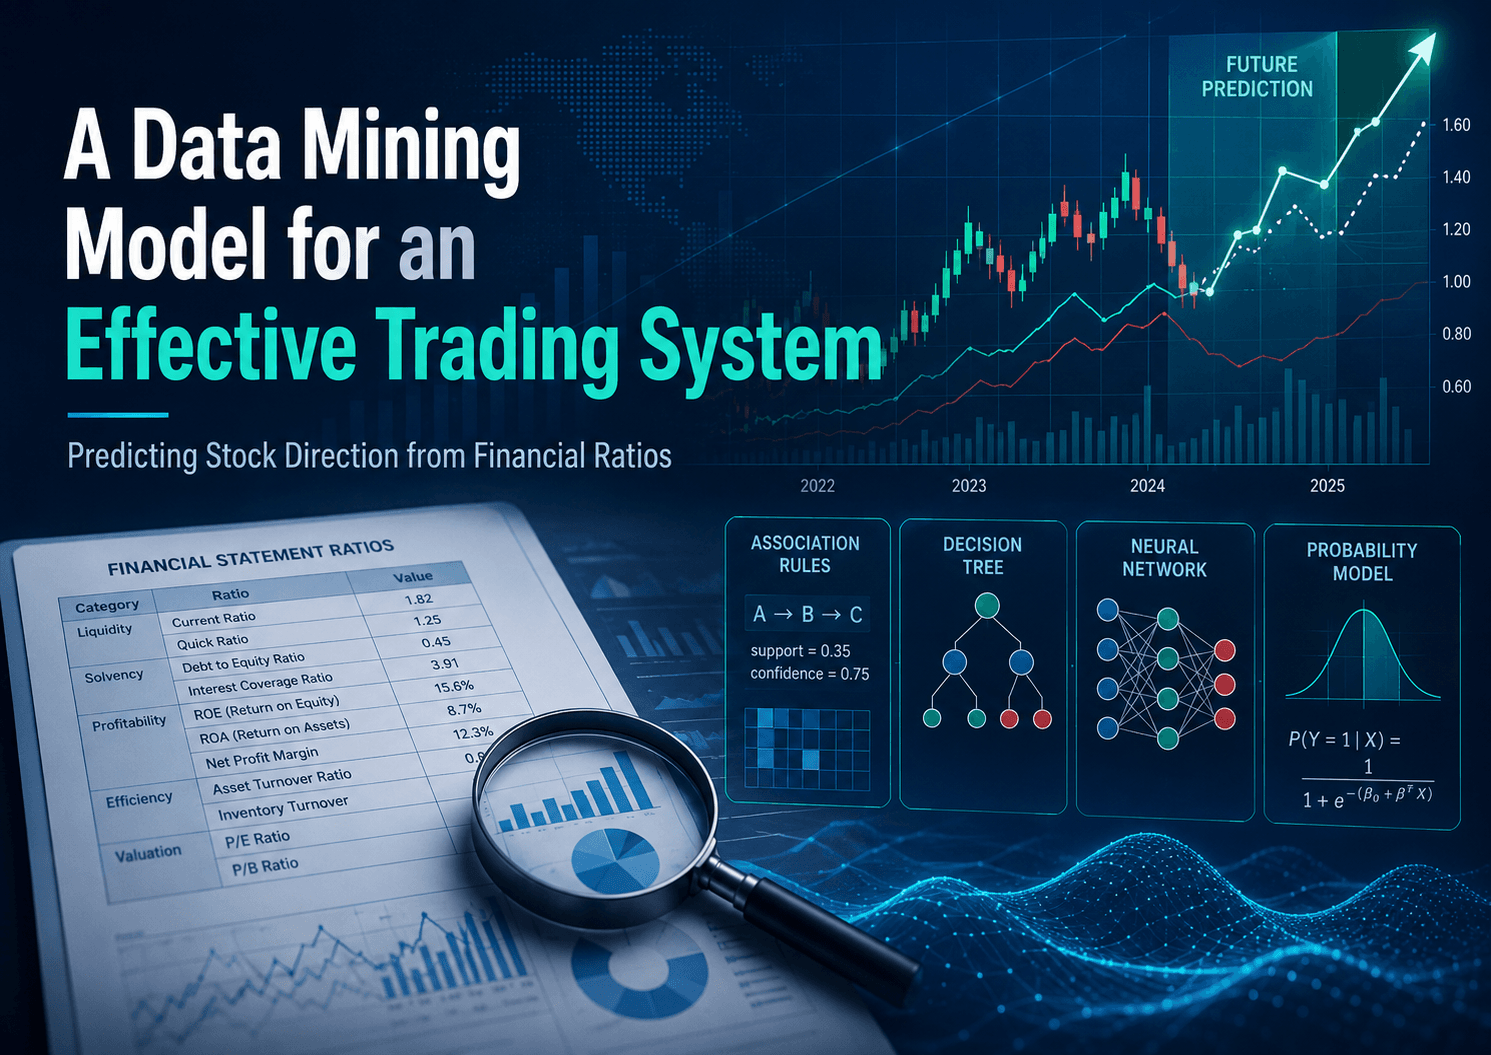
This research identifies the weight and threshold of financial statement ratios for predicting the future stock direction. The predictions are on a quarterly basis. The paper takes a contrarian strategy position. The investors may use the results during the fundamental analysis phase of an investment. Several data mining models are used to identify the most relevant variables, with the strongest predictability. The results suggested that the Association Rule model have a 71.43% accurate predictability on the stock direction looking at a handful number of variables. We placed our analysis on the published financial statement for five previous years of 100 companies listed in the S&P 500 index.

Introduction
Investors use different methods to predict stock price direction, including fundamental analysis, technical analysis, and behavioral analysis. During this process, they choose which variables to focus on, often based on experience, investment style, or strategy.
At Marywood University in Scranton, Pennsylvania, the Pacer Investment Fund gave graduate students the opportunity to manage real investments under faculty supervision. The team focused primarily on value investing and contrarian strategies, aiming for long-term profitability with controlled risk.
Their investment decisions typically began with fundamental analysis, reviewing financial statements and calculating key ratios to evaluate a company's financial health. This was followed by technical analysis to study stock price trends and behavioral analysis to consider broader economic, political, and market influences.
Because each stage of the decision-making process depends on valid assumptions and reliable data, understanding which financial variables matter most is critical.
Research Problem
One of the main challenges in fundamental analysis is determining which financial variables most strongly influence stock price direction. It is also difficult to identify the threshold values those variables should reach in order to suggest whether a stock price is likely to rise or fall.
The goal of this study was to identify the most important financial variables affecting stock price direction and determine the thresholds associated with them, particularly in the context of a contrarian investment strategy.
Related Work
Previous research on contrarian investing often focused on constructing portfolios using selected variables and then measuring performance over time. However, many studies did not clearly explain why specific variables were chosen.
For example, prior research used measures such as beta, market risk premium, earnings-to-price ratio, book-to-market value, cash flow-to-price, and growth rates. While these studies showed results, they often lacked clear justification for variable selection.
This study aimed to address that gap by using data mining techniques to identify which variables actually matter most when analyzing financial statements.
Methodology
The analysis used published financial statements from S&P 500 companies over the previous five years. Quarterly financial data was collected, and a variety of ratios were calculated, including measures related to liquidity, capital structure, and inventory management.
The initial dataset included thousands of rows of company-quarter observations. Data was reviewed internally for validity and completeness. Because the study focused on contrarian stocks, only companies with a beta of 1 or lower were included.
The data was then matched to stock price movement by quarter, indicating whether the stock price increased or decreased compared with the previous quarter.
Different data mining models were then trained using part of the dataset and tested on the remaining portion. The models received only financial ratios as input and attempted to predict whether the stock price would go up or down. Their predictions were then compared with actual market outcomes.
Results — Association Rules (AR)
The Association Rule model identified meaningful relationships among variables linked to stock price increases and decreases.
For stock price increases, the strongest indicators included a high P/E ratio, a high current ratio, a high quick ratio, and inventory turnover within a specific range. The most relevant thresholds included:
| Variable | Threshold |
|---|---|
| Current ratio | ≥ 2.2 |
| Inventory turnover | 1.8 – 4.2 |
| Cash ratio | ≥ 0.64 |
| P/E ratio | > 14.04 |
The Association Rule model reached 71.43% accuracy in predicting stock direction while using only a limited number of variables, based on published financial statements from companies listed in the S&P 500 over a five-year period.
Related Publications
This research was extended and presented at two additional conferences:
Harnessing Data Mining Models to Enhance Trading Effectiveness — The Institute for Public Policy & Economic Development, 2013
Predicting stock price movements with ever increasing accuracy can have a profound impact on the finance industry. It can enhance trading effectiveness resulting in valuable business outcomes, better investment decisions and better risk management. As such, traders, analysts, investors and hedge funds are always looking for techniques and models to better predict stock price movements.
Data Mining Models Comparison for Predicting the Stock Price With a Focus on Industry Segmentation — RISE Forum, University of Dayton, 2013
We build on our prior research by introducing the industry segment as an attribute when comparing the prediction accuracy of several data mining models on the stock price. The data mining models used in the comparison are Naïve Bayes, Neural Networking, decision trees, linear regression, and Association rules.